


No products in the cart.
NEWS
Soil Testing: How To Take Samples And Read Results
What Is Soil Testing?
It is the farmland analysis for multiple parameters like chemical content, toxicity, pH level, salinity, earth-dwelling biota, etc. Such tests also provide information on chemical contamination, humic or organic content, electric conductivity, cation exchange capacity, and other physical and chemical properties.
Types Of Soil Tests
The analysis type depends on the explored components or properties of the field ground that may beneficially or adversely impact crop development. The most frequently-used types analyze and measure:
- mineral content,
- pH level,
- soil moisture,
- salinity,
- pesticides and chemical contamination,
- structure and texture, etc.

Soil Nutrient Testing
Valuable information on nutrients content allows accurate fertilization to support plant needs within precision agriculture implementations. This is why the chemical test for soil nutrients is the most common.
Primarily, soil tests report on the content of nitrogen (N), phosphorus (P), and potassium (K), which are the most important nutrients for crops. Secondary nutrients to examine are calcium (Ca), sulfur (S), and magnesium (Mg). An extended test also includes minor elements like iron (Fe), manganese (Mg), boron (B), molybdenum (Mo), and others.
To test soil nutrient content, a sample is added to an extractant solution and mixed (typically by shaking). Then, the liquid content is filtered and analyzed for chemical elements’ presence and concentrations (converted to dry matter). The obtained number is the soil-test index George Hochmuth, Rao Mylavarapu, and Ed Hanlon. Soil testing for plant-available nutrients—what is it and why do we use it? Publication #Sl408. 2018. University of Florida, Institute of Food and Agricultural Sciences Extension.
Soil Acidity Test (pH)
Proper pH in the field is essential for plant productivity, and either too high or too low pH will adversely affect crop growth. Testing pH of soil, one calculates its hydrogen ions. pH values may range from 0 to 14. The neutral value is 7, lower levels are for acidity, and higher than 7 mean alkalinities. Acidic or alkaline fields are treated correspondingly. For example, pH can be raised with lime, and an accurate pH test helps determine its required quantity.
Soil Salinity Test
In saline fields, plants suffer from osmotic stresses due to poor water absorption. Soil salinity testing helps understand the suitability of lands for agricultural activities. Field salinity can be analyzed through:
- evaporation of total soluble salts (TSS) from the ground-water extract;
- measuring the electric conductivity (EC) of a saturated paste extract or a distilled water-earth dilution Hardie, Marcus, and Richard Doyle. “Measuring soil salinity.” Methods in molecular biology (Clifton, N.J.) vol. 913 (2012): 415-25. doi:10.1007/978-1-61779-986-0_28.
An electric conductivity soil test is performed in the field or a designated laboratory.
Testing Soil For Pesticides and Contaminations
Pesticides help control any non-beneficial organisms that destroy crops. Chemicals effectively suppress weeds, manage crop diseases, or combat pests. At the same time, such substances poison non-target organisms and pollute nature. Highly aggressive substances leach into groundwater, remain in the land for many years, and harm humans and animals, accumulating in food.

Chemical contaminants reduce the yield quality, so it is important to conduct testing soil for pesticides before seeding and plan subsequent crop treatment based on past field activities and productivity.
Physical Soil Testing For Texture And Structure
Apart from the chemical content, agricultural soil testing also analyzes the soil type and its physical properties like texture, structure, and moisture.
The main components are clay, sand, and silt, and their proportions define the ground texture and its ability to retain nutrients with moisture. For example, sandy fields dry faster than clay ones, so a soil texture test helps in precision irrigation and fertigation planning.
Soil structure describes the size of its parts and pore spaces, which affect the flow of water and air in the earth. Clay fields are finer, and their pore spaces are small. Therefore, they are prone to compaction and require regular aeration.
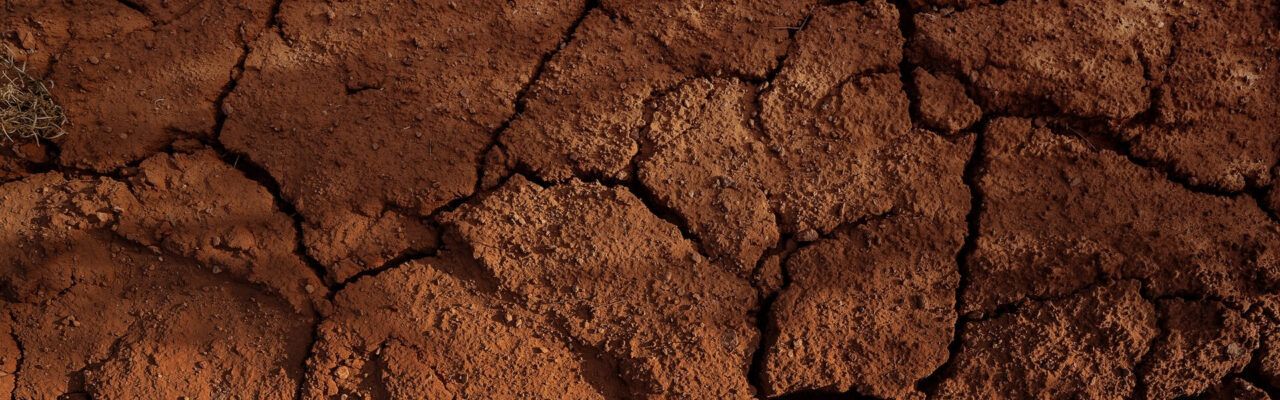
Soil Moisture Testing
Water is essential for plant growth, and vegetation cannot develop properly under a lack of ground moisture. When the field’s surface is dry, it can be noticed visually; yet accurate water rates are measured with soil moisture sensors or in the laboratory. A soil moisture content test reports water availability for plants or their dehydration. High-temperature moisture evaporation from samples is the typical soil moisture test. The calculation of moisture rates in the samples is based on measuring their masses before and after evaporation.
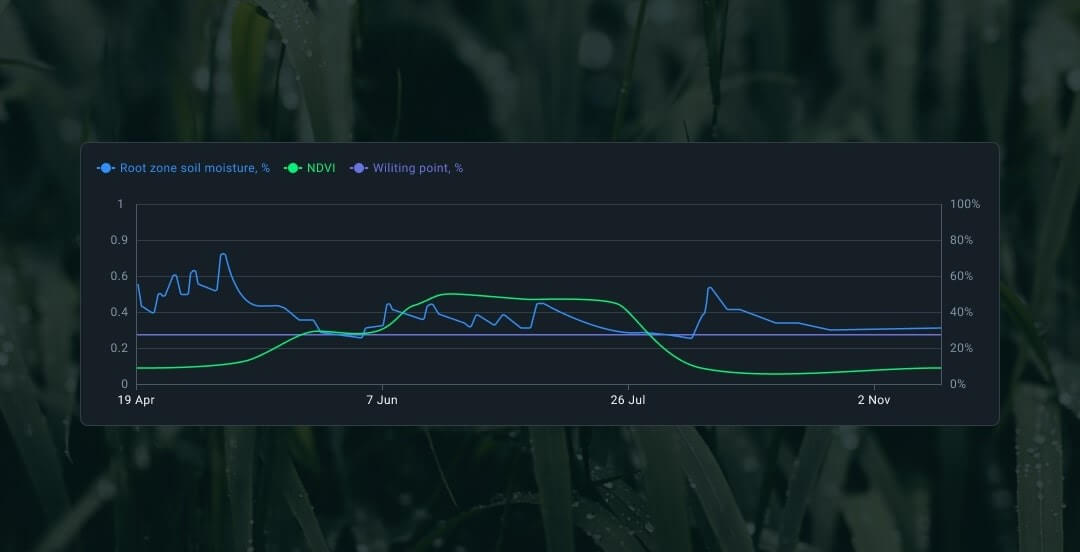
It is important to monitor the moisture in the field before seeding and throughout the whole season to get high yields. EOSDA Crop Monitoring allows checking the surface and root-zone moisture levels remotely. Besides, historical data shows the moisture level at each plant growth stage. Based on this data, farmers can predict the moisture deficit and make proper decisions. Additionally, the NDMI index on EOSDA Crop Monitoring helps find critical zones, and further soil moisture sampling of these areas will show if they are indeed dehydrated.
The chart below shows a correlation between soil moisture and NDVI. The optimum level of humidity for growing sunflowers on loamy soil is 65%. To keep the maximum yield, it can be lowered by 40%. In June, the humidity drops below 25% – the wilting point – and this is reflected in the NDVI. In this case, the model showed that the harvesting resulted in 2374 kg/ha of crop instead of the maximum possible 3961 kg/ha.
How To Get The Soil Tested?
Deciding on how to conduct a soil test, you can choose any options:
- Do it yourself with special kits.
- Send samples for a professional analysis to a state or private laboratory. Soil test procedures in some local labs are free.
- Hire a company that will cover the whole process from sampling to field amelioration recommendations.
How To Take Soil Samples For Testing
Farmland analysis provides necessary information for correct field treatment, but the precision of the results depends on accurate sampling. The basic soil sampling methods are based on grids and zones Farmaha, Bhupinder Singh, William Caughman, and Dara Park. Precision Agriculture Based Soil Sampling Strategies. (2020)..

Grid Sampling
This method is based on equally spaced grids, usually one to five acres. The smaller the grid, the more accurate the result is. The larger the grid, the more subsamples are needed. For example, a one-acre grid cell requires a minimum of five subsamples, while up to ten subsamples should be collected for grids of five acres. Grid soil sampling provides spatial information on the field, but it doesn’t consider ground variability.
Zone Soil Sampling
This method suggests taking average samples from each field zone. The field is divided into zones based on crop maps or the soil type. Each zone has similar conditions, so the zones’ number and sizes depend on their variability. Usually, the sizes range from two to ten acres. The larger the zone, the more soil test probes are required (at least five subsamples for each zone, two subsamples per acre).
Agronomic soil testing gives detailed information on field health, but several data sources can provide even better insights. This is where the Zoning feature on EOSDA Crop Monitoring is particularly useful. Satellite-based productivity maps on the platform show field variability through vegetation indices, helping more accurately outline different zones for sampling. Such a combination assists in making decisions on necessary chemical inputs depending not only on the vegetation state but specific properties of each zone.
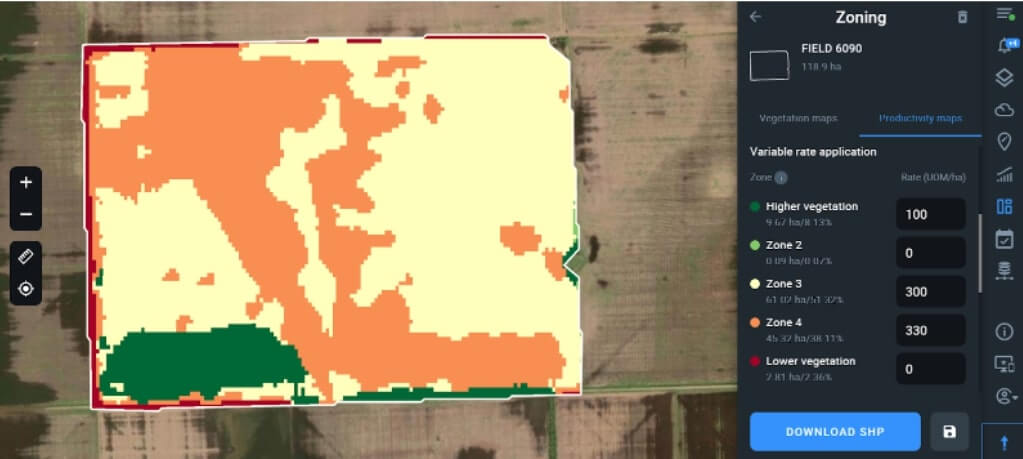
The field on the screen above is divided into 5 zones based on the NDVI index. According to the map, samples should be taken in different zones of the field with low vegetation, paying attention to Zone 3 and Zone 4. The “Lower vegetation” zone is red, because this is the edge of the field and nothing grows there; Zone 2 is very small – so there is no point in taking samples there. Recommendations for fertilizer application are filled in for each zone according to the level of vegetation.
How To Read A Soil Test?
A laboratory report usually includes the results on the specified parameters and the volumes of chemical elements in the samples. It is important to know nutrient norms and correspondingly adjust their concentrations.
For example, the required nitrogen concentrations depend on the soil type and are the highest for clay fields:
- sandy earths (25 – 50 mg-N/kg);
- loam earths (50 – 75 mg-N/kg);
- clay earths (75 – 125 mg-N/kg).
Apart from nutrient content, a soil test report may include the following parameters:
- Class indicates humic matter content and falls into three types: mineral, mineral-organic, and organic. Mineral-rich fields (MIN) have low humic concentrations, while organic ones (ORG) are the richest in humus. In mineral-organic fields, (M-O), humic content is medium.
- Organic matter (OM) shows organic matter content in the samples. Except for sandy grounds, organic matter norms for row crops are 2.5% or higher.
- Cation Exchange Capacity (CEC) measures the ability of the field ground to retain cations (positively charged ions). The average values are 13-25 CEC but can vary from 1 to 40.
Farm soil test results from a laboratory may include amelioration recommendations to increase yields, for example, fertilizer adjustments or lime applications to reduce acidity. However, a laboratory report provides information only on the current state of things in the field. For this reason, it is also important to consider the following historical data of field conditions while understanding soil test results for nutrient supplies:
- crop types and crop rotation;
- tillage depth for conventional tillage;
- conservation tillage or no-till practices;
- soil type;
- fertilization or fertigation events.
The process of interpreting soil test results won’t be complete without these aspects because each of them makes a certain impact on the field.
Soil Testing For Agriculture-Related Businesses And EOSDA Crop Monitoring
Timely field health analysis helps mitigate economic and ecological risks not only in farming but the whole agricultural sector:
- agriculturalists can avoid crop diseases and improve farm performance;
- agri-coops can monitor their members’ productivity;
- input suppliers can understand the demand in their products;
- crop insurance companies can track proper field maintenance when validating claims;
- bank institutions can decide on the expediency of granting agricultural loans.
Soil sampling and testing are also necessary when buying a new field or deciding on land use. The analysis of field nutrients helps maintain long-term field fertility, contributing to sustainable agriculture.
EOSDA Crop Monitoring doesn’t test soil directly but helps in preliminary situation assessment remotely, sparing the necessity of taking samples in the whole field. Thus, vegetation maps on the platform point out the critical zones. Then, the scouts get their tasks with the exact areas for sampling in the Scouting section. Besides, EOSDA Crop Monitoring essentially supplements soil test analysis with historical data on crop production and tracks a decrease or increase in yields year by year – all in one place.
There are several options to use our facilities in your business. Vegetation indices, productivity maps, and other EOSDA Crop Monitoring features are also available in a White Label module or through API. Request the details from our sales team at [email protected] and find out the benefits of using our products in your niche.
References
- George Hochmuth, Rao Mylavarapu, and Ed Hanlon. Soil testing for plant-available nutrients—what is it and why do we use it? Publication #Sl408. 2018. University of Florida, Institute of Food and Agricultural Sciences Extension↑Online source
- Hardie, Marcus, and Richard Doyle. “Measuring soil salinity.” Methods in molecular biology (Clifton, N.J.) vol. 913 (2012): 415-25. doi:10.1007/978-1-61779-986-0_28↑Journal article
- Farmaha, Bhupinder Singh, William Caughman, and Dara Park. Precision Agriculture Based Soil Sampling Strategies. (2020).↑Journal article